Research · Energy & Buildings 273 (2022) · MIT Senseable City Lab · Urban Big Data Centre, Glasgow
Rating a city's homes
from the kerb
Every home sold or let in Scotland carries an energy label from A to G. For 165,000 Glasgow properties we asked whether a neural network could predict that label from the building's own paperwork and one photograph of its front. Adding the photograph lifted accuracy from 79.7% to 86.8%, and the model could say why.
Tap a band to see how common it is in Glasgow and how often the model gets it right.
01
Why a letter on a certificate matters
Buildings consume nearly 40% of the energy used in developed countries. Knowing which homes waste the most is the first step towards retrofitting them, cutting household bills, easing fuel poverty and meeting carbon targets. Scotland has committed to net zero by 2045, and the UK government wants as many private rented homes as possible at band C or better by 2030.
The Energy Performance Certificate, or EPC, is how that efficiency is recorded. Since 2008 a UK home must have one whenever it is built, sold or let. An assessor notes the size and layout, the walls, roof, floor, windows, heating and hot water system, and a government calculation turns those notes into a rating from A, the best, to G.
Predicting that rating at city scale has been awkward. Engineering calculations and simulations are accurate but need detailed system data that is not public. Statistical models usually lean on occupant behaviour, such as the number of residents and the thermostat set point, or on consumption indicators such as CO2 emissions. Those are hard to collect, change with every new tenant, and are so close to the answer that they say little about the building itself.
What if the only inputs were things that already exist for almost every street: the property's own EPC description, and a photograph of its façade?
That is the proposal. A multi-source data fusion network reads the structural and morphological attributes from the EPC in one branch and a Google Street View image of the building in the other, then combines them to classify the rating. Because the inputs are open, the method can move to other cities. And because the model is interpretable, it can also say which features of a home push its rating up or down, which is what a homeowner planning a renovation actually wants to know.
02
Glasgow, one certificate at a time
Glasgow is a good test. It is one of the largest cities in the UK, its housing ranges from Victorian sandstone tenements to post-war towers and new-build estates, it has an ambitious net-zero deadline, and Scotland publishes its EPC register openly.
- 168,410domestic EPC records, October 2012 to March 2021
- 165,318geocoded inside the study area
- 368,769façade photographs linked to a certificate
Each address was geocoded and matched to a building footprint from the UKBuildings dataset, which is what makes it possible to aim a camera at the right wall. Street-view photographs were requested for every property, including historical imagery from 2008 to 2021, keeping only captures at least two years apart so the model would not see near-duplicates.
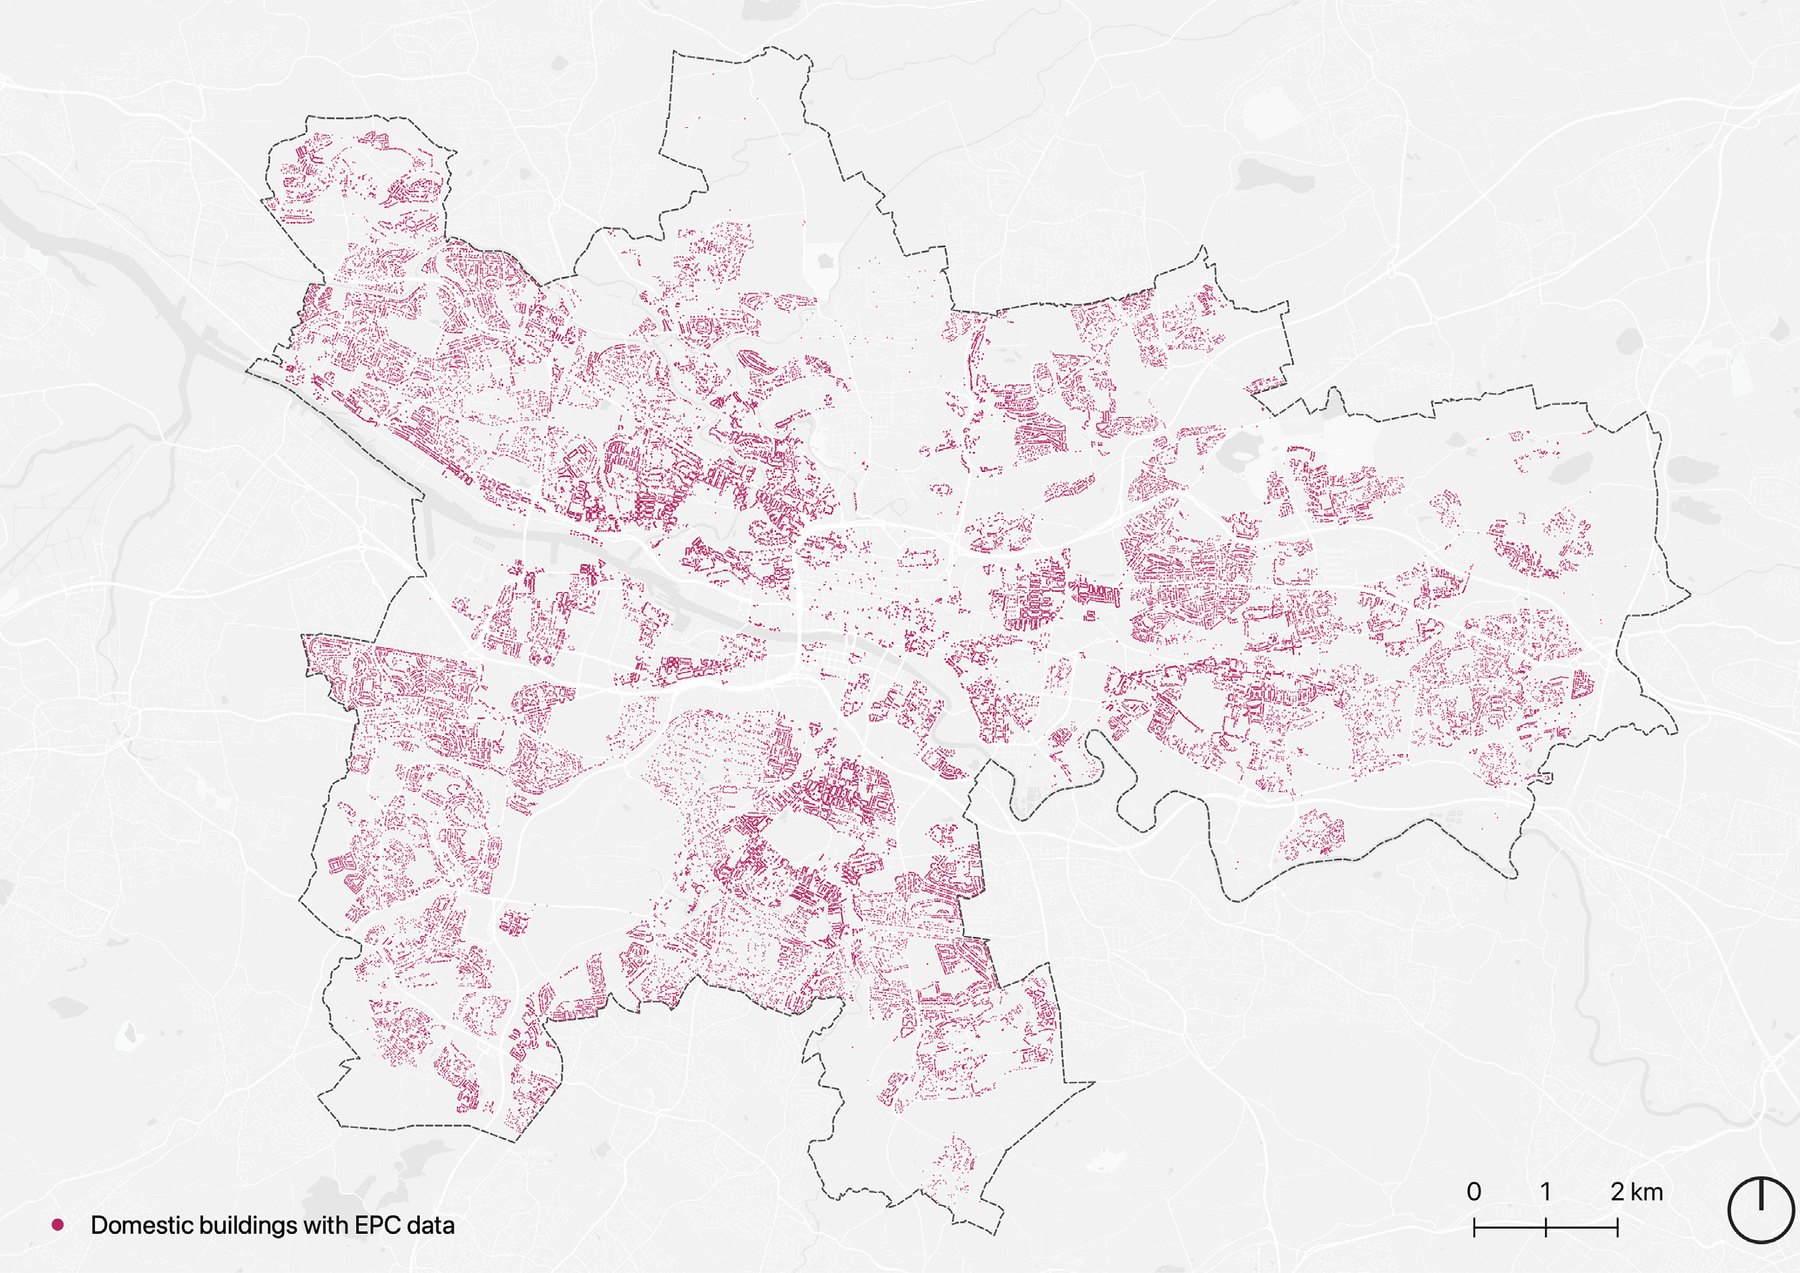
From register to training set
Hover or tap a bar for the count.
What a certificate describes
Only attributes that describe the building and its basic fittings are used, never energy consumption or occupant behaviour. Four are numbers. The rest are categorical descriptions that an assessor writes down.
Categorical attributes include wall, roof and floor construction and insulation, glazing type and date, main heating system and fuel, heating controls, hot water source, built form, and construction age band.
03
Three angles to a good photograph
Street View's default picture looks along the road. The model needs the building, framed and centred. Three camera parameters are computed for each property from its footprint and the nearest point on the street.
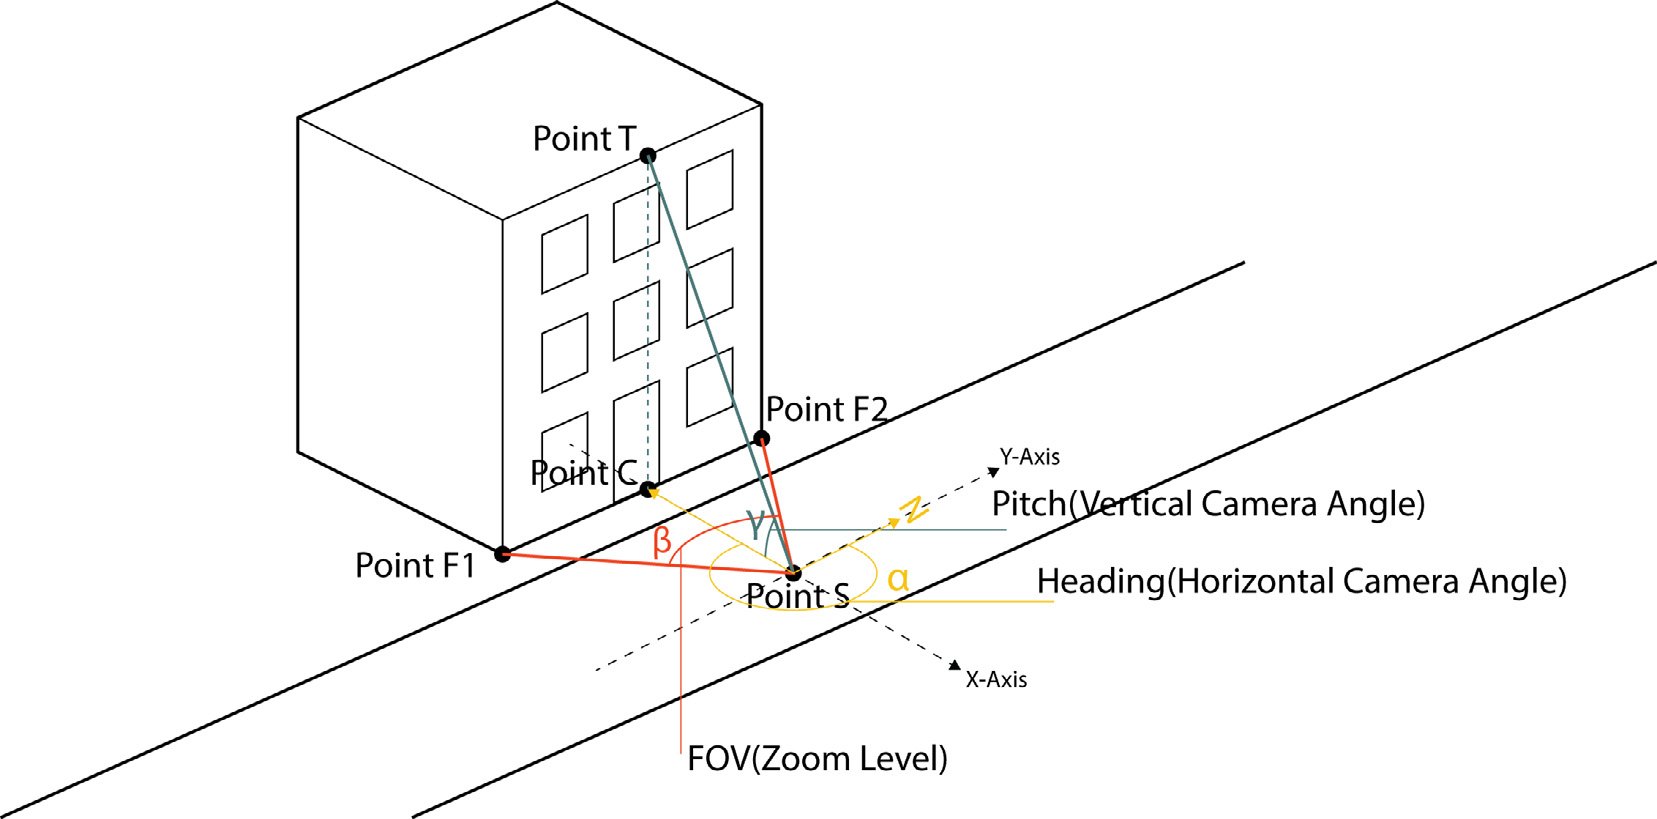 α heading
γ pitch
β field of view
1 · Heading
Take the request point S on the street and the centre C of the façade's bottom edge. The heading is the clockwise angle from north to the line from S to C. Point the camera there and the building, not the road, fills the frame.
2 · Pitch
Tall tenements overflow a level camera. The pitch tilts it up by half the angle between the line to the bottom of the façade and the line to its top, so the picture is centred on the middle of the wall.
3 · Field of view
The zoom is set from the angle between the two façade corners seen from the street, so a wide building gets a wide lens and a narrow one is not lost in context. The API caps it at 120°, so the smaller of the two values is used.
04
Two branches, one rating
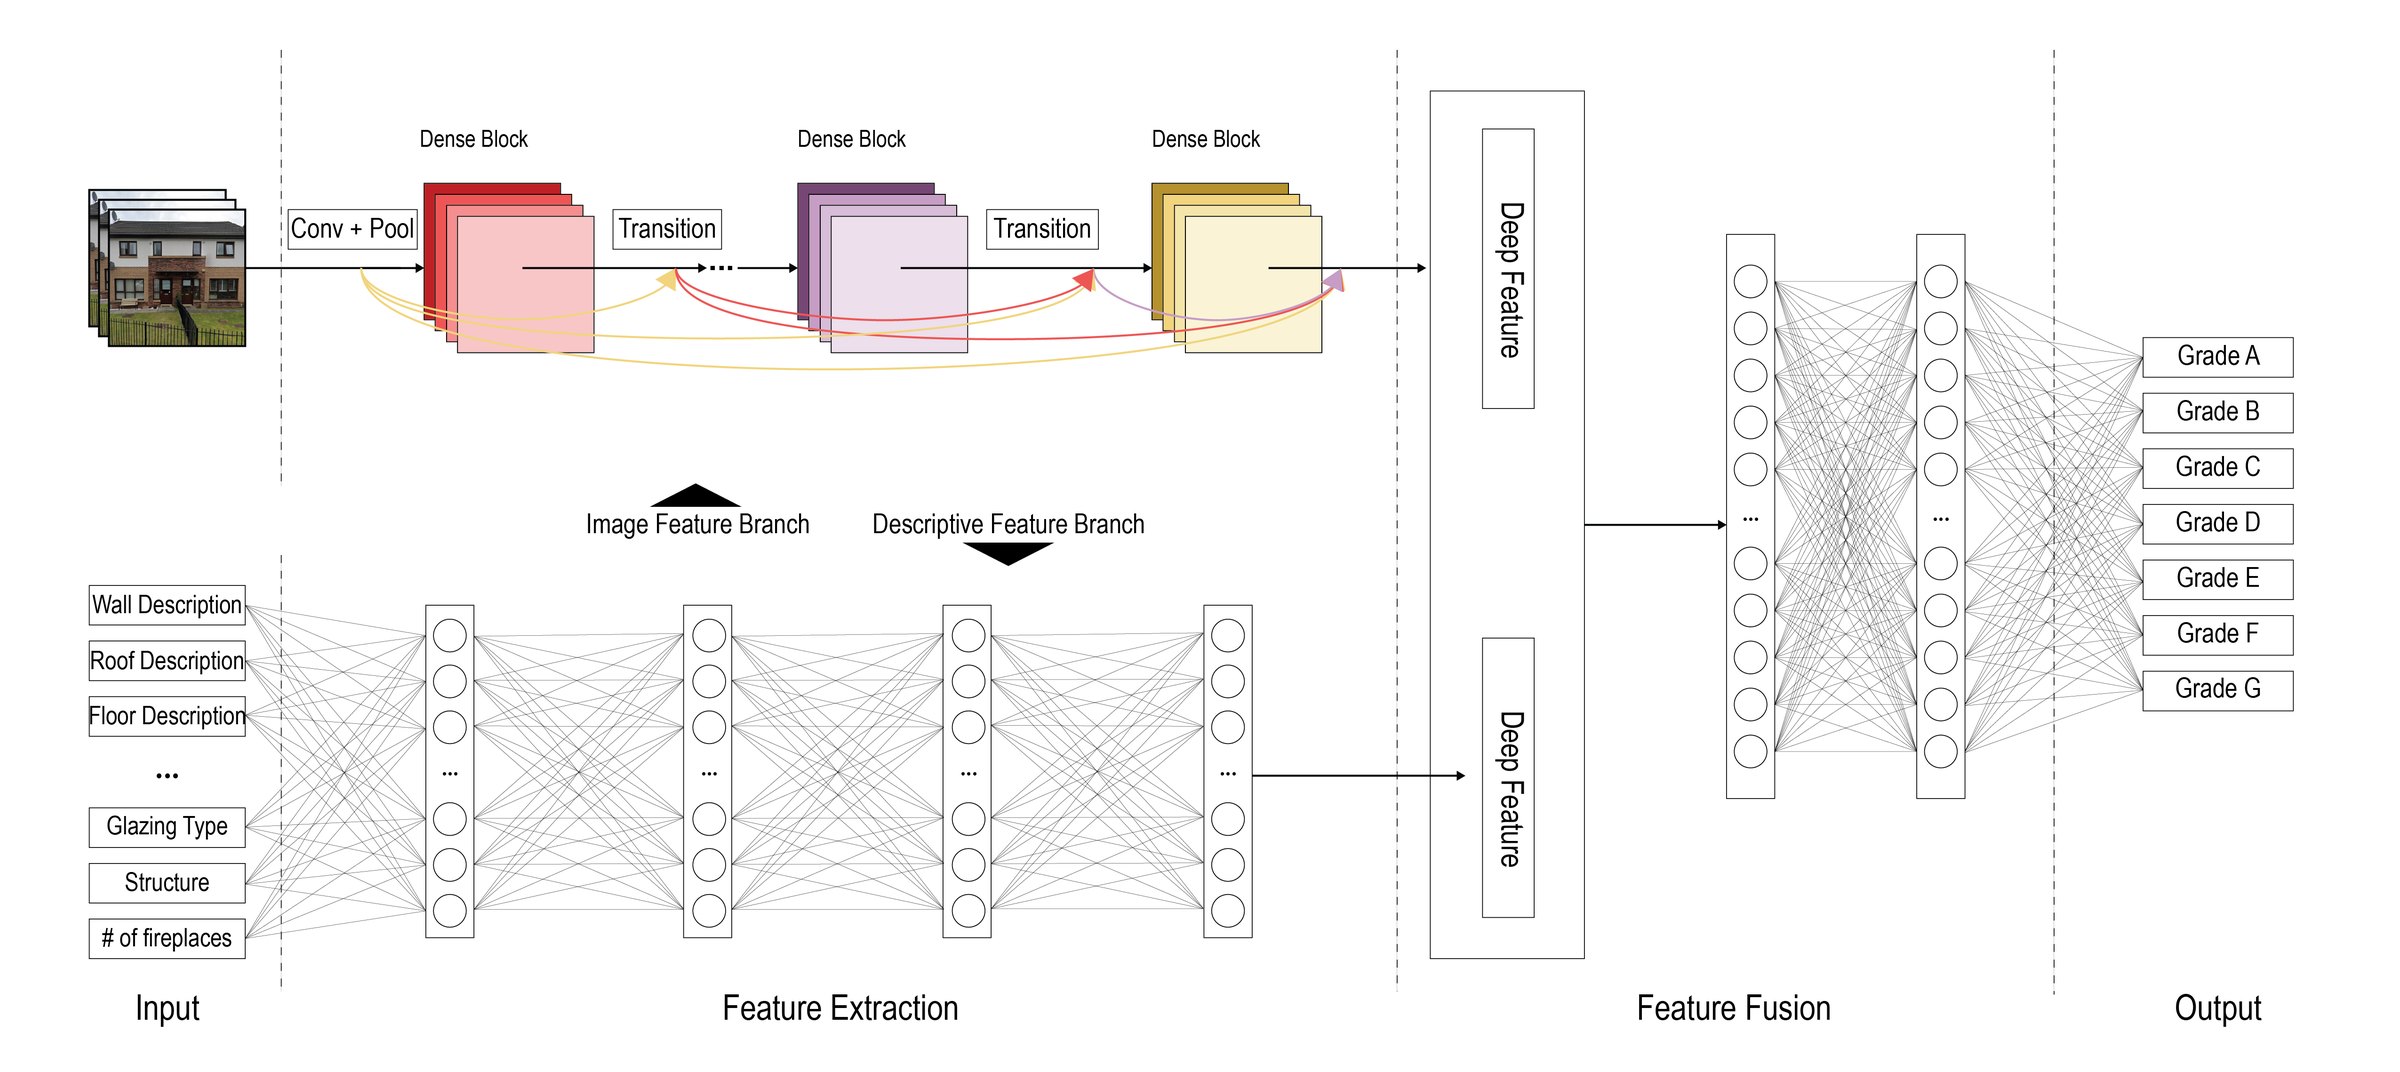
The network reads both kinds of evidence at once. An image branch built on DenseNet, four dense blocks initialised from ImageNet weights, turns the façade photograph into a 1,024-number feature. A descriptive branch, a small fully connected network with four hidden layers, turns the EPC attributes into 256 numbers. The two are concatenated and a final classifier picks one of seven bands.
Band by band
Recall, precision and F1 for the fusion model on the test set. Band A has only 171 examples in 368,769, so it is the hardest to learn.
Most bands are recognised more than three quarters of the time, and nearly every miss lands in a neighbouring band: an F read as E, an A read as B or C. The ordering of the scale is something the model has absorbed.
05
Does the photograph help?
To find out, two more models were trained on exactly the same split: one that sees only the façade image, and one that sees only the EPC attributes. The image alone is weak. A front elevation says something about age and materials but nothing about the boiler. The attributes alone do well. Together they do best, and the gain is not just in the headline number.
Test-set performance of the three models. Hover a bar for the value.
Where each model's guesses land
Rows are the true band, columns the prediction, as a share of each true band. Switch models and watch the diagonal sharpen.
The image-only model funnels almost everything into C and D, the two most common bands. The attribute-only model is sharper but never predicts A at all and mistakes a third of F homes for E. The fused model lifts every band and is the only one with a balanced diagonal. The façade is adding information that the paperwork does not contain.
06
Accuracy across the city
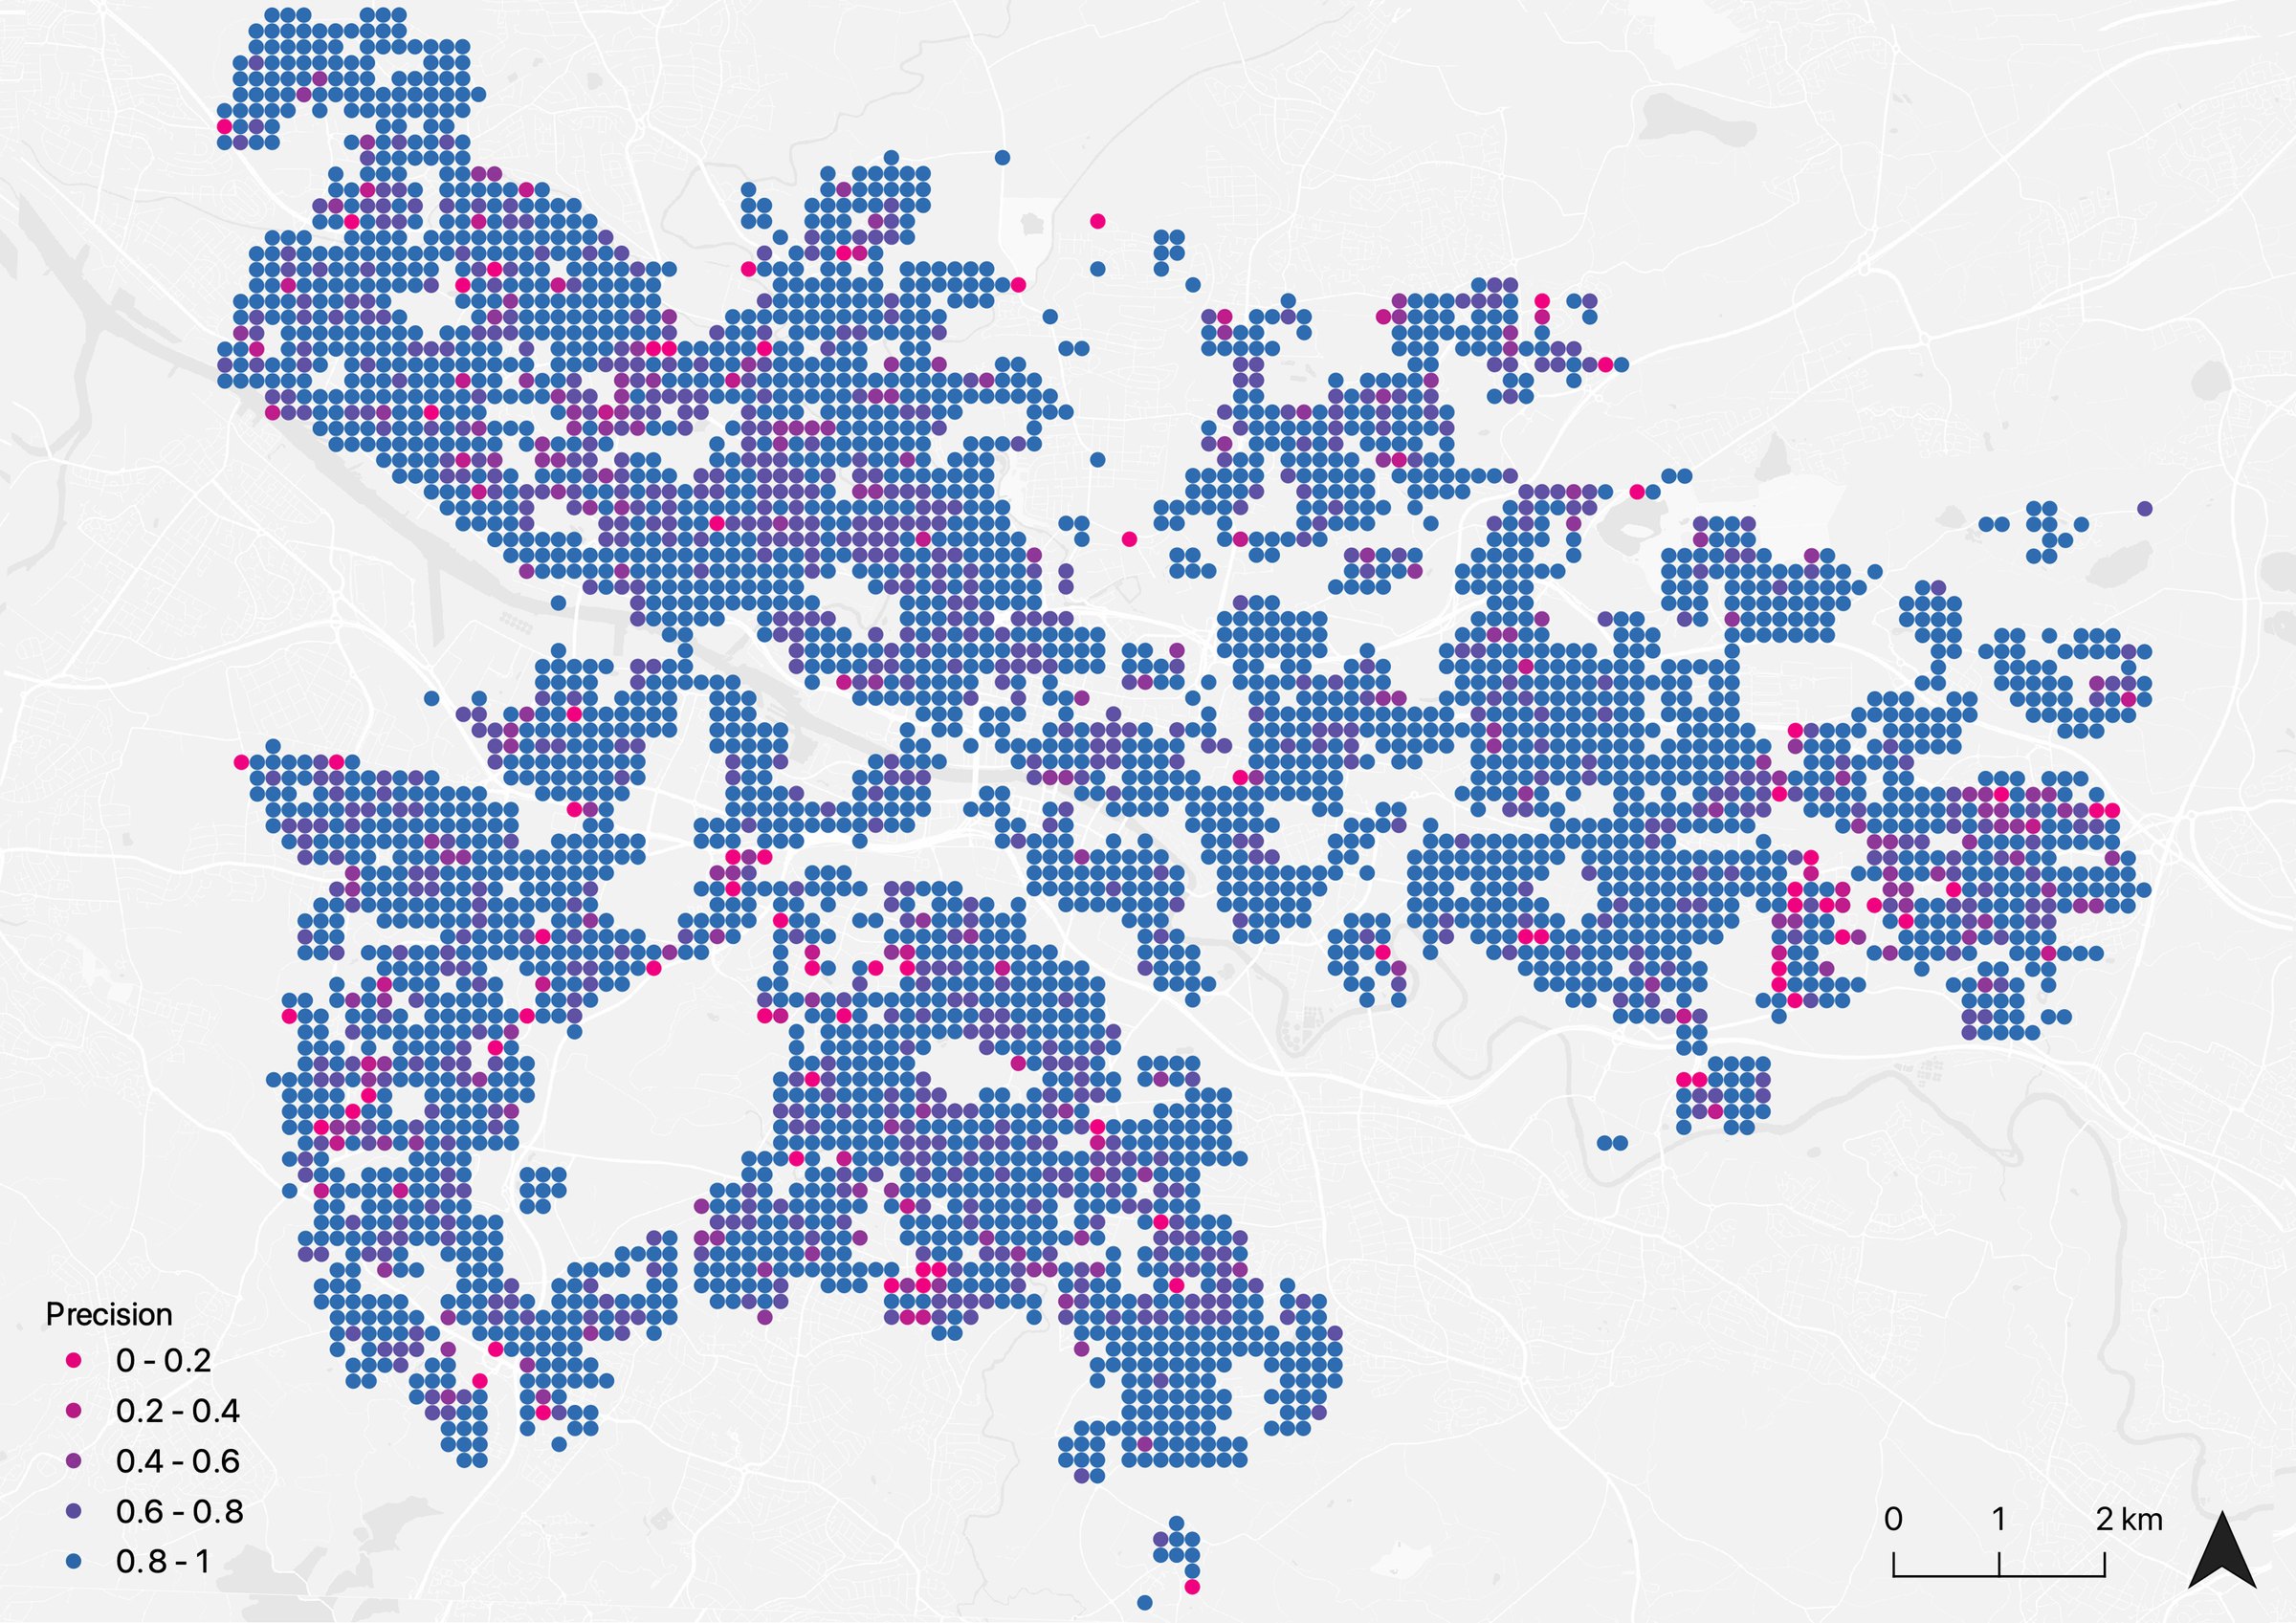
Predictions are made for individual properties, but policy is made for neighbourhoods, so the results are aggregated to 150 m cells and scored by the share of properties classified correctly. Neighbouring buildings tend to share an age, a style and a façade material, so a cluster of errors would point to a kind of housing the model does not understand.
There is no such cluster. The great majority of cells score above 80%, the weak cells are scattered rather than grouped, and a global Moran's I of 0.14 confirms only faint spatial autocorrelation in the errors. The model works about as well in one part of the city as in another.
Global Moran's I of grid-cell precision. Errors are spread thinly across Glasgow rather than concentrated in particular districts.
07
What the model says matters
A rating is only useful to a homeowner if it comes with reasons. SHAP values, a method from cooperative game theory, measure how much each input pushed a prediction towards a worse or better band. Applied to the EPC attributes, they rank the features the model relies on.
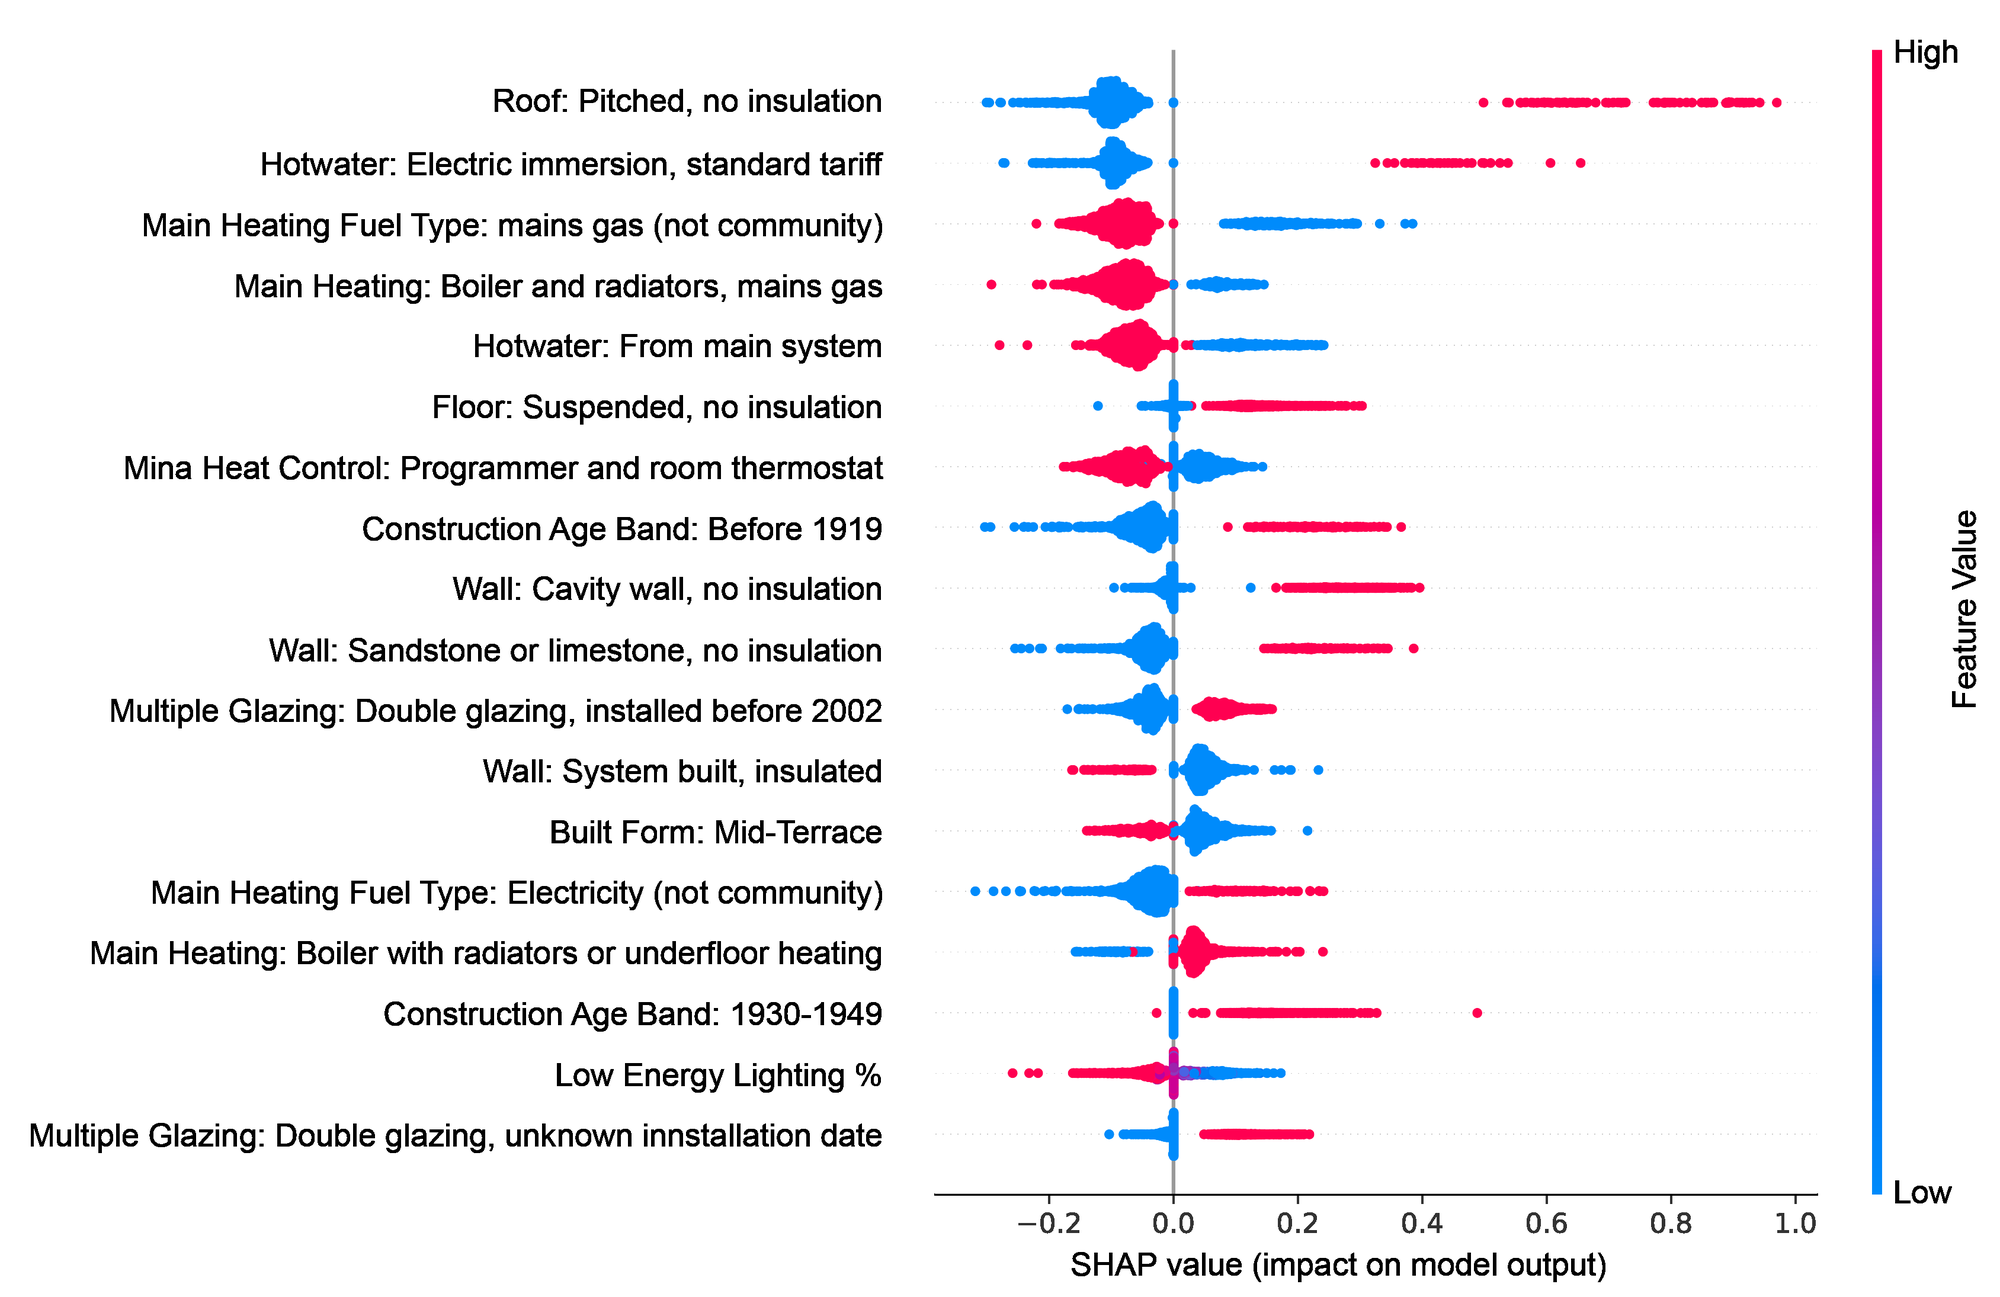
The ranking agrees with intuition and sharpens it. Insulation dominates: an uninsulated pitched roof is the single most influential attribute and drags ratings down, uninsulated walls and floors follow, and an insulated system-built wall pushes the other way. The heating and hot water system matters almost as much as the fabric. Age counts too, and a home built before 1919 is penalised more than one from 1930 to 1949. For someone deciding between a new boiler and loft insulation, the plot is a priority list.
Where it looks in the photograph
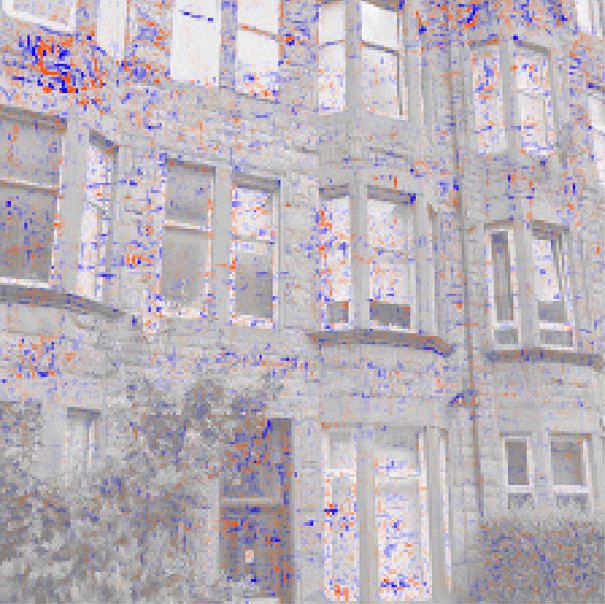
The same method can be applied to pixels. For random façades from the dataset, the pixels that most influenced the fused model's decision gather around the openings: window frames, bays, doors and the lines of the storeys. The model is not keying on cars, sky or shopfront signs. It has found the parts of a building that a surveyor would look at.
08
What this changes
- A rating from public data. EPC attributes plus one street-view photograph classify a Glasgow home's band correctly 86.8% of the time, at 133 properties a second. No smart meter, survey or simulation is needed.
- The façade carries real information. Adding the image to the attributes raised accuracy by seven points and fixed the weakest bands. Street view is a proxy for age, style and material that the certificate does not fully capture.
- A model that explains itself. SHAP turns the classifier into advice: insulate the roof and walls first, then look at the heating system. City administrations can aggregate the same predictions to target the most energy-deprived neighbourhoods.
Limits
EPC ratings are themselves estimates, and the gap between an assessed and an actual energy performance is well documented, so part of any error is in the label. The detailed attributes the model leans on exist only inside the EPC database, which covers roughly half of homes in Great Britain, while street view covers nearly all of them. Future work will trade some accuracy for inputs that are available everywhere, so the framework can reach the homes that have no certificate yet.
Sun, M., Han, C., Nie, Q., Xu, J., Zhang, F., & Zhao, Q. (2022). Understanding building energy efficiency with administrative and emerging urban big data by deep learning in Glasgow. Energy & Buildings, 273, 112331.
DOI (open access) Code on GitHub Data documentation (Zenodo) Back to research
Energy Performance Certificates: Scottish EPC register. Building footprints: UKBuildings via EDINA Geomni Digimap. Street-view imagery: Google. Supported by the ESRC through the Urban Big Data Centre (ES/L011921/1, ES/S007105/1), the Urban Studies Research Incentivization Funding at the University of Glasgow, and the National Natural Science Foundation of China (41901321).