Research · Cities 128 (2022) · MIT Senseable City Lab
Reading a city's age
from the street
Four Amsterdam façades, four centuries. A neural network learned to tell them apart from ordinary street-view photographs. This is how it did it, where it stumbled, and what it taught us about the evolution of architectural style.
Tap a façade to guess its construction year, then reveal the answer.
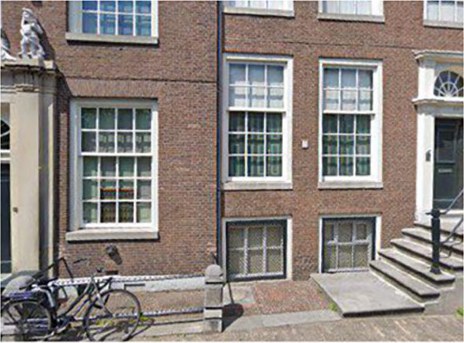
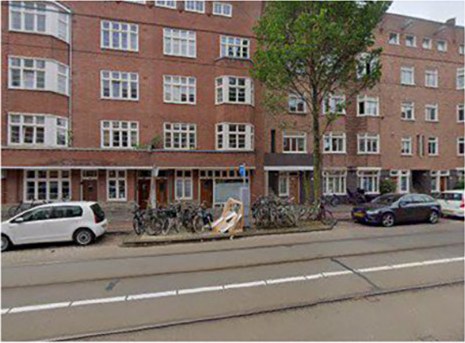
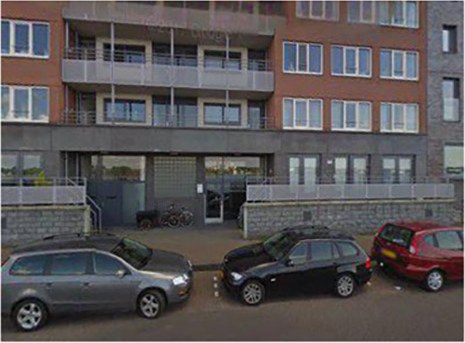
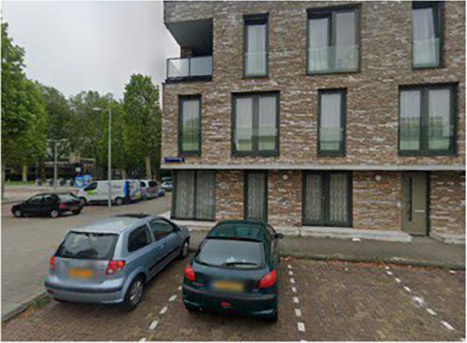
01
Why a building's age matters
Age is one of the most useful things to know about a building, and one of the hardest to find out. It feeds energy models, because a 1920s wall and a 1990s wall lose heat very differently. It flags which properties are vulnerable in an earthquake or a flood. It moves rents and sale prices. And it tells planners where a renovation programme would do the most good.
Yet the records are patchy. OpenStreetMap carries construction years for only a small fraction of buildings in most cities. LiDAR and 3D city models can estimate age from form, but they are expensive to fly, heavy to process, and simply do not exist for most of the world.
Every street has already been photographed. Street view is public, global, and refreshed every few years. If a human can glance at a façade and say "that's prewar", could a model learn to do the same at the scale of a whole city?
The framework has two stages. Deep learning trains a convolutional network to classify façade photographs into age epochs. Deep interpreting then takes the trained model apart to ask what it learned: how styles are shared between cities, which façade elements betray a building's age, how epochs relate to one another, and how age and architectural style are linked.
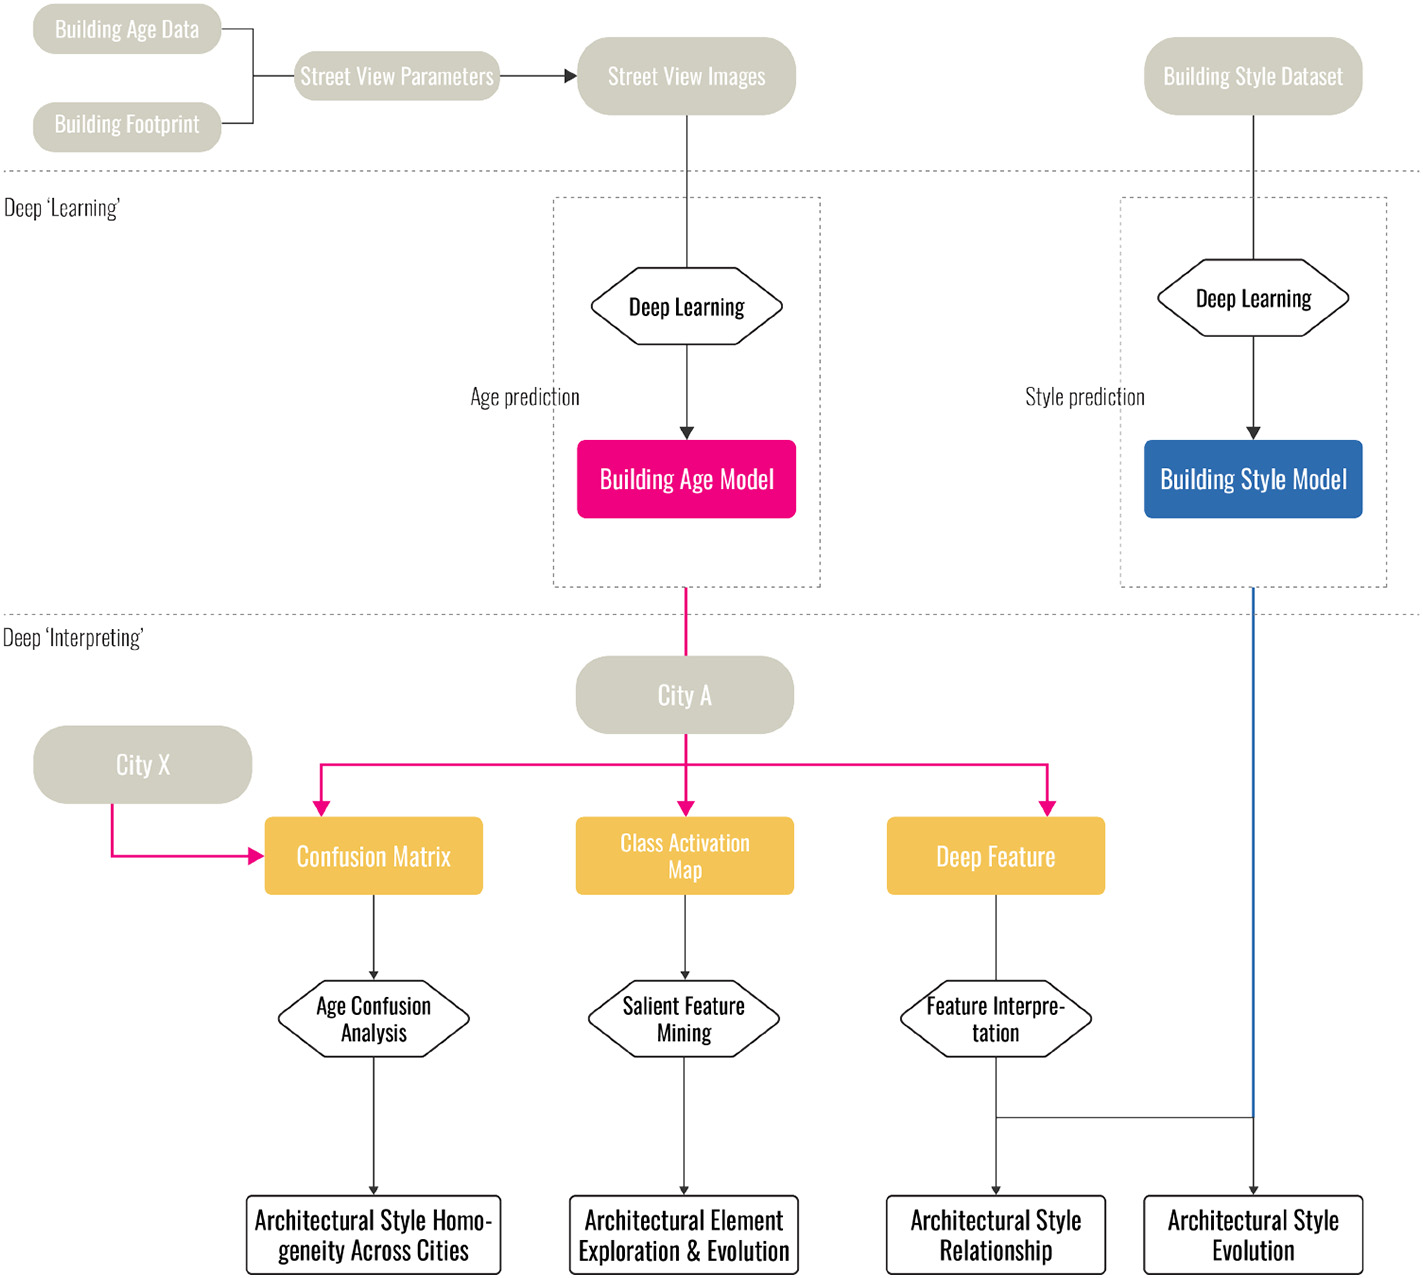
02
A city with seven centuries of layers
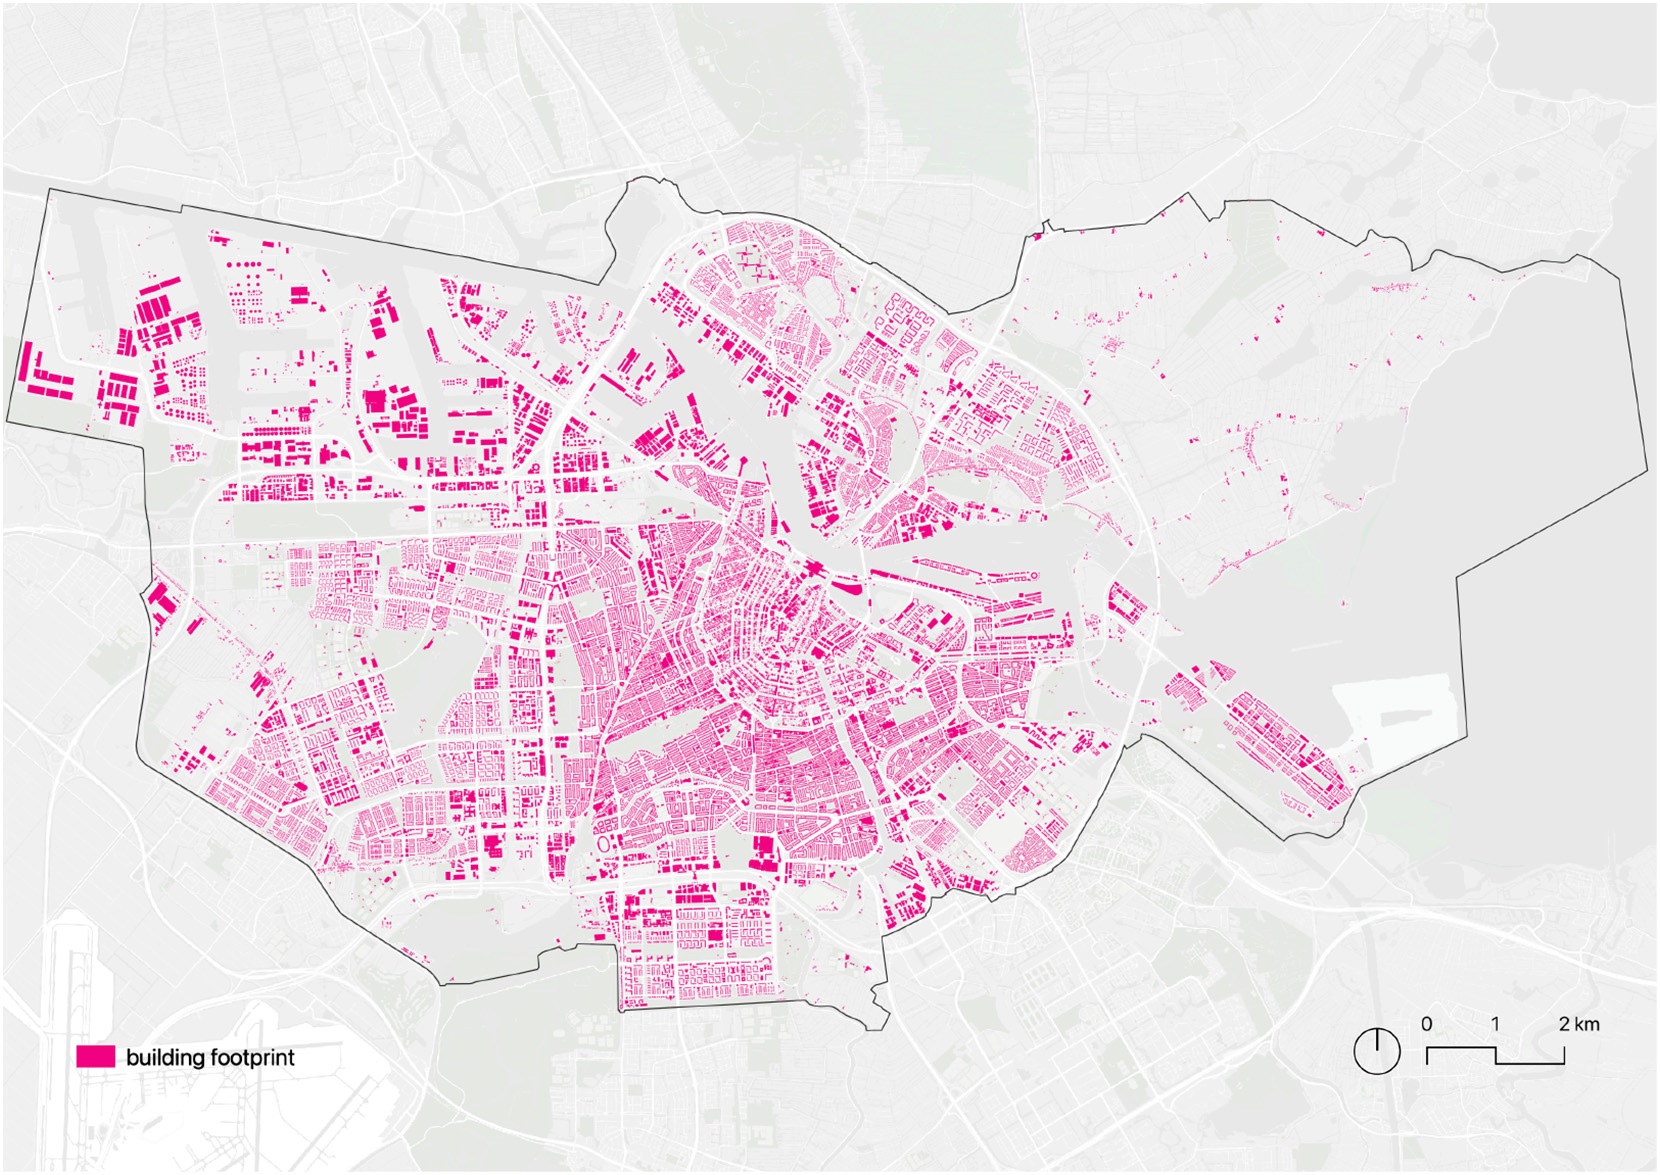
Amsterdam is a good place to try. It has grown in rings since the 1300s, so buildings from almost every era stand within a few kilometres of each other. And the Netherlands publishes an unusually complete building register, the BAG, which records a construction year for nearly every address.
- 182,737addresses in the Amsterdam register
- 173,863with a valid construction year
- 1300–2020range of construction years
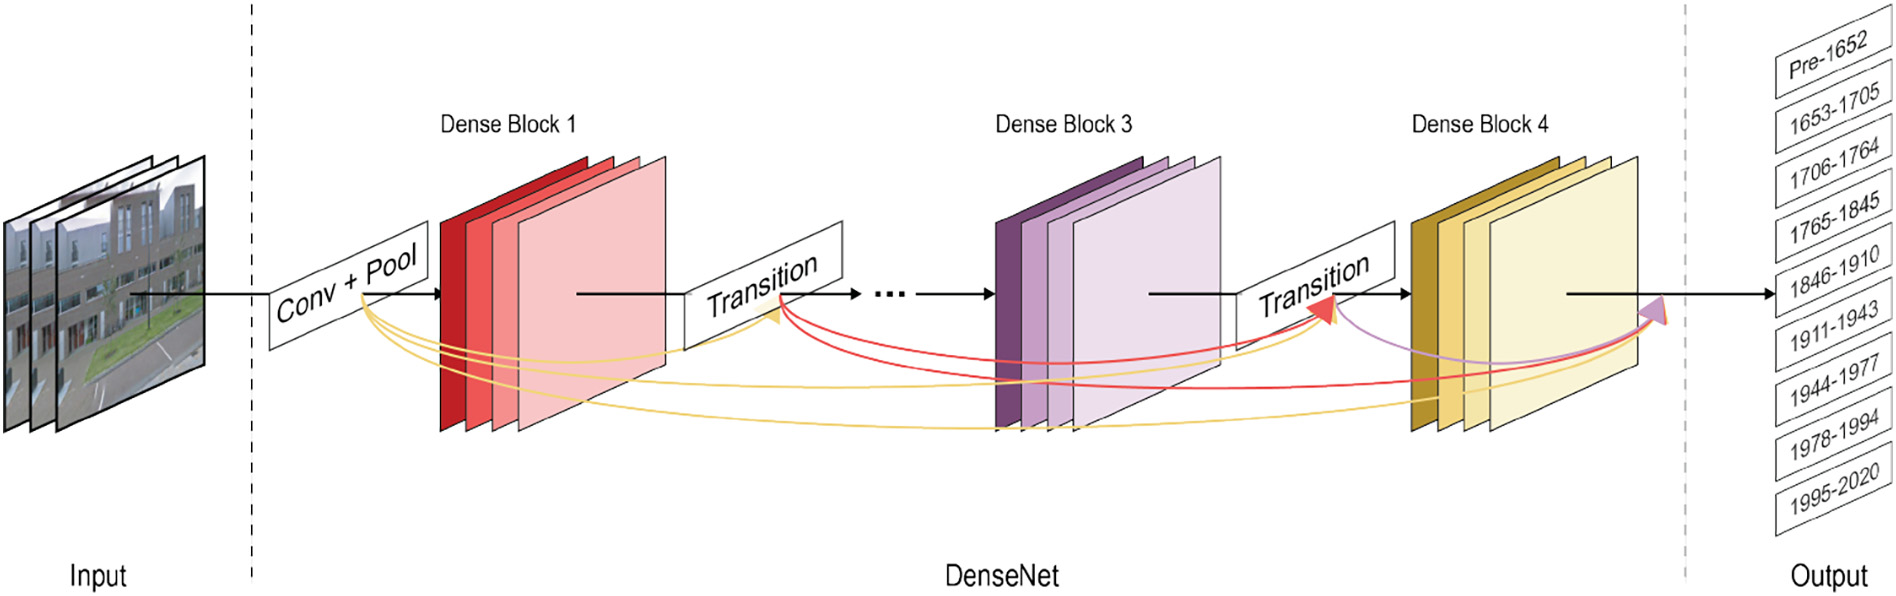
Rather than predict an exact year, the model sorts façades into nine epochs that follow the city's own history of expansion, from the medieval core to the post-1995 waterfront.
Nine epochs of Amsterdam
Hover or tap an epoch. The thin strip underneath shows the same epochs to true scale.
03
Pointing the camera at the right wall
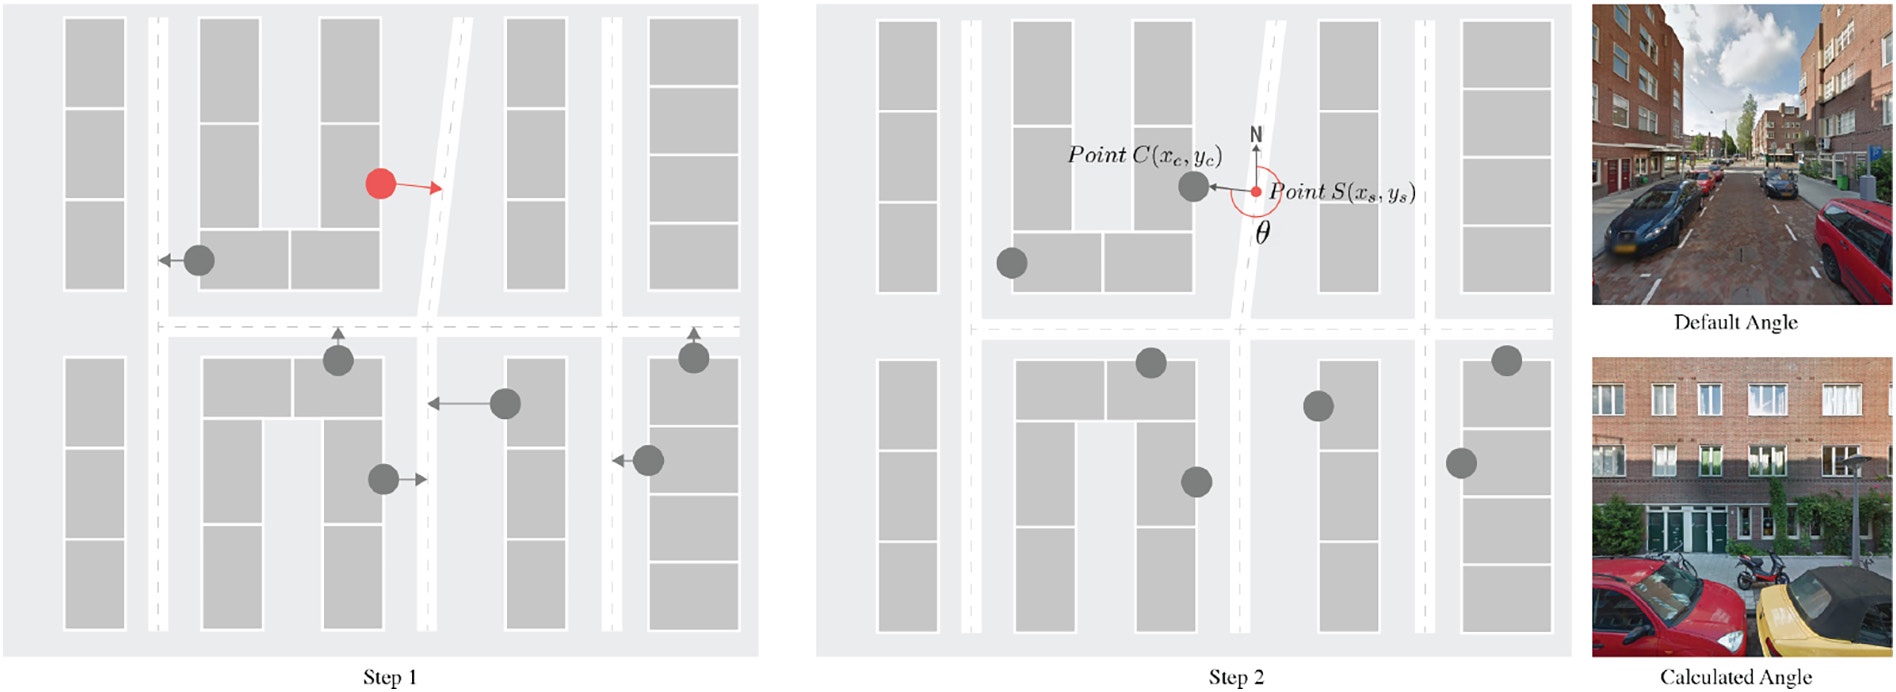
A street-view panorama, by default, looks down the road. For this task the camera has to look at the building. Each training photo was requested with a heading computed from the map itself.
Keep a photo only if
- Building is the largest semantic category in the image, and
- buildings cover more than 40% of the pixels.
Pixels are labelled by a scene-parsing network trained on ADE20K, which knows 150 categories such as sky, tree, road and building.
1 · From footprint to heading
Take the midpoint of each building's façade from the BAG footprint and project it onto the nearest street. The angle between north and the line from that street point to the façade is the camera heading. Request the panorama at the street point, pointed at that angle, and the building fills the frame instead of the road.
2 · Throw away the bad shots
Some photos are taken too far away. Others are hidden behind trees, vans or scaffolding. Instead of checking by hand, every candidate image is run through a scene-parsing model and kept only if buildings dominate the picture.
3 · A balanced training set
Most of Amsterdam was built after 1900, so the three earliest epochs are rare. Their images are horizontally flipped to add samples, while the crowded epochs are randomly thinned. The result is a set of about 39,000 façades, one fifth of which is held back to test the model across the whole city.
04
Teaching the network to see time
The classifier is built on DenseNet121, a convolutional network in which every layer passes its features forward to every later layer in the block. It starts from weights pre-trained on ImageNet, so it already knows edges, textures and everyday objects, and is then fine-tuned on façades.
Where the guesses land
Each row is the true epoch, each column the model's prediction. Hover or focus a cell for the exact share. Darker is larger.
Every epoch is recognised more than three quarters of the time, and the misses are mostly neighbours: a 1911–1943 house taken for a 1944–1977 one, a 1995–2020 block taken for 1978–1994. The model is not memorising labels. It has picked up something that changes gradually with time.
05
Where the model is wrong, and why that is interesting
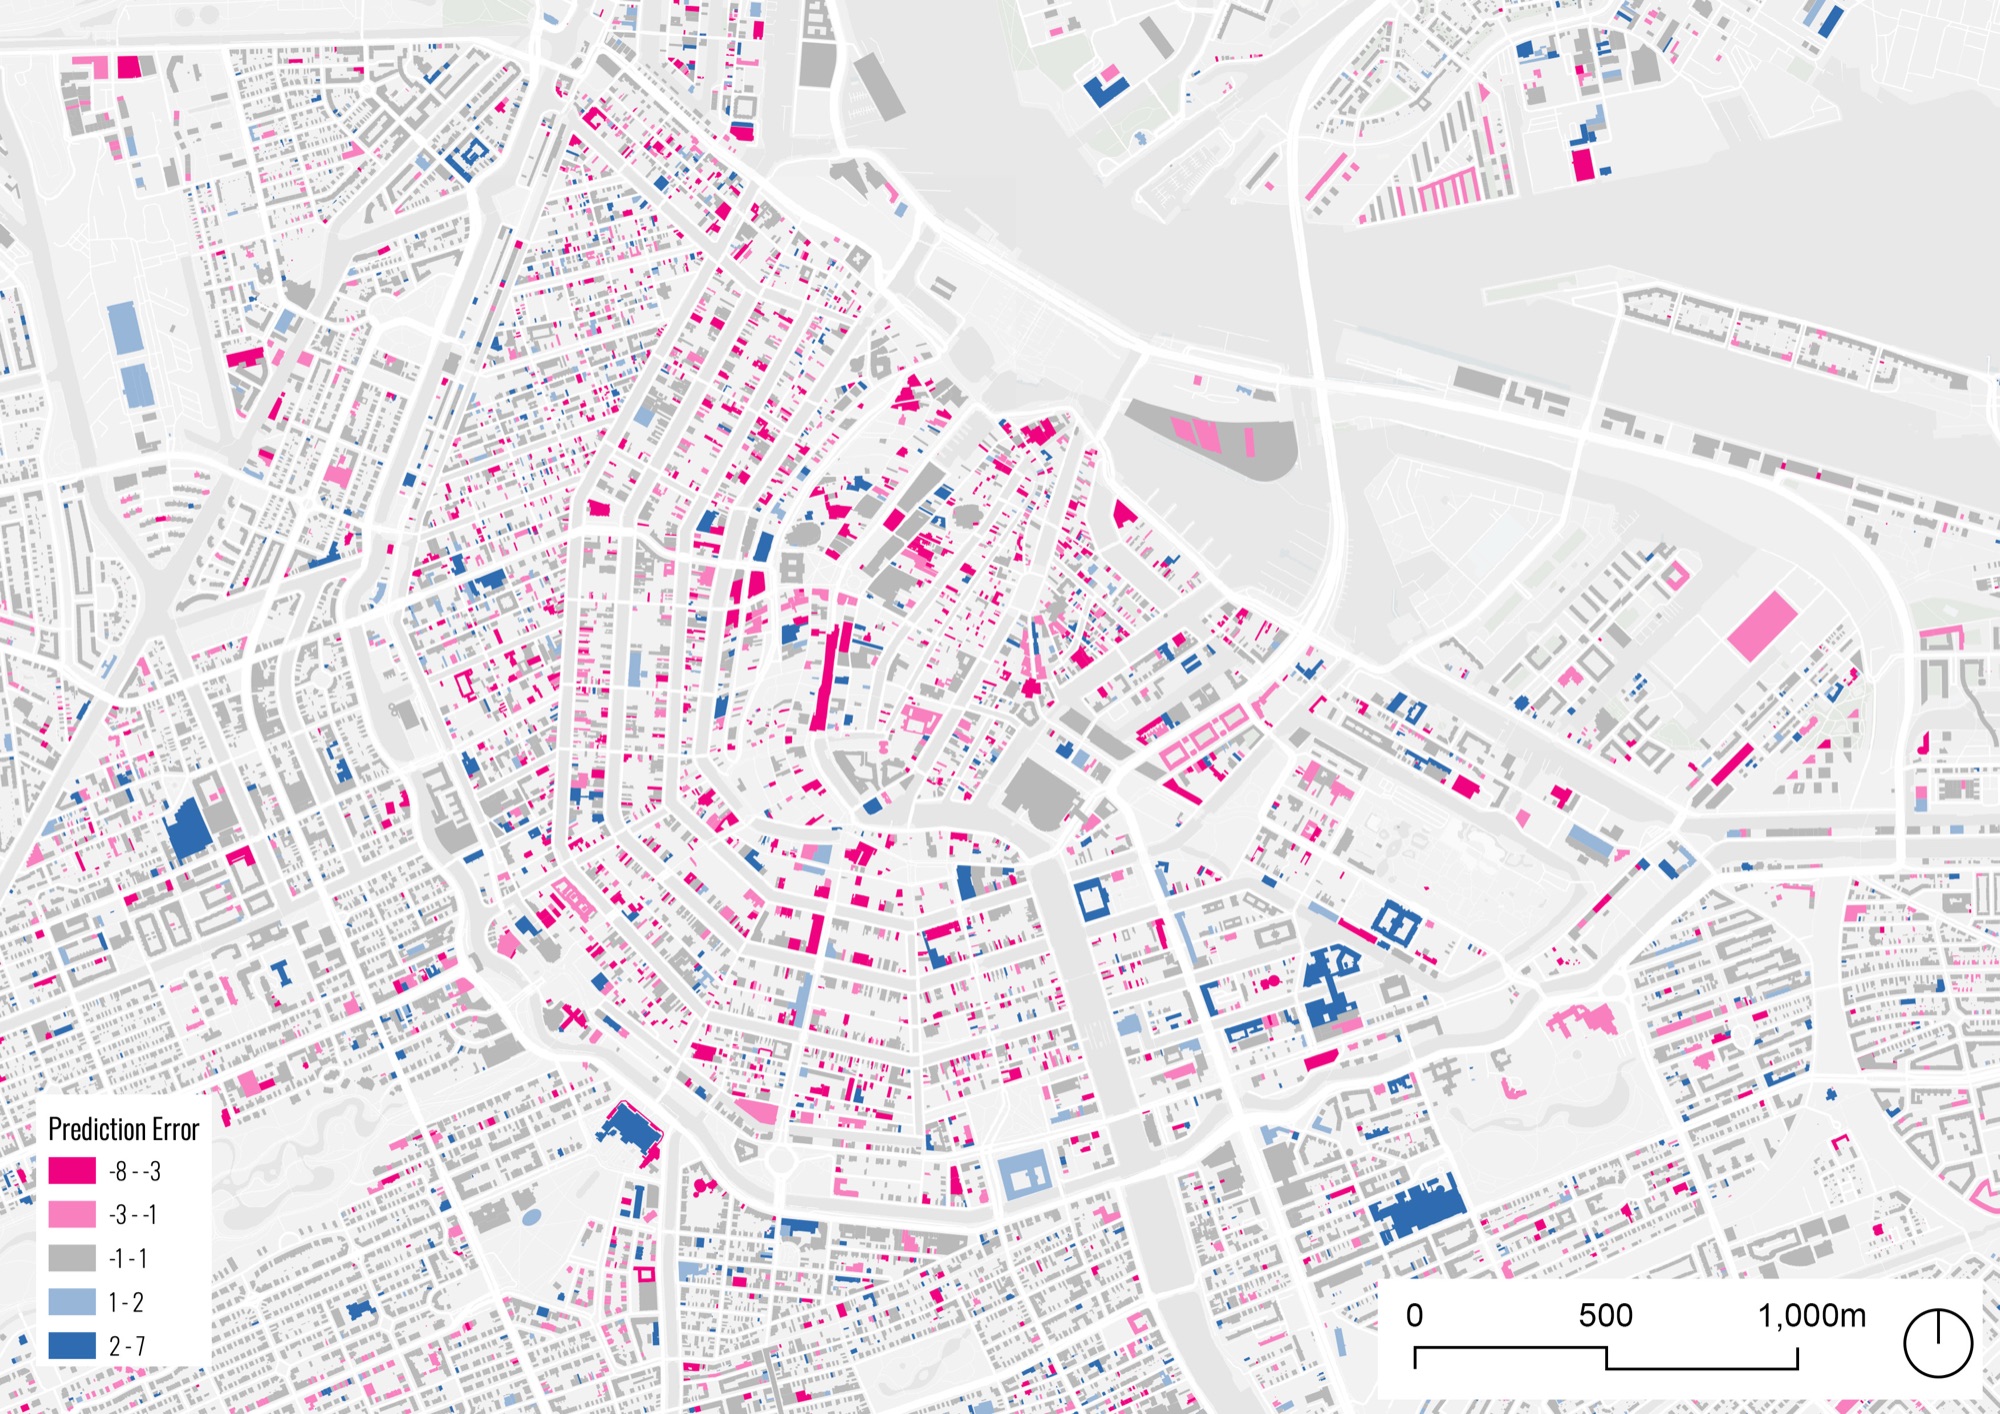
Plot every error on the map and a pattern jumps out. The canal ring is speckled with magenta: buildings that are actually recent but which the model reads as centuries old. The reason is not a bug in the model. The historic centre is a UNESCO World Heritage site, and under the Dutch Monuments and Historic Buildings Act new construction there must preserve the historic fabric. These buildings are built in an old style. The model is reporting what it sees.
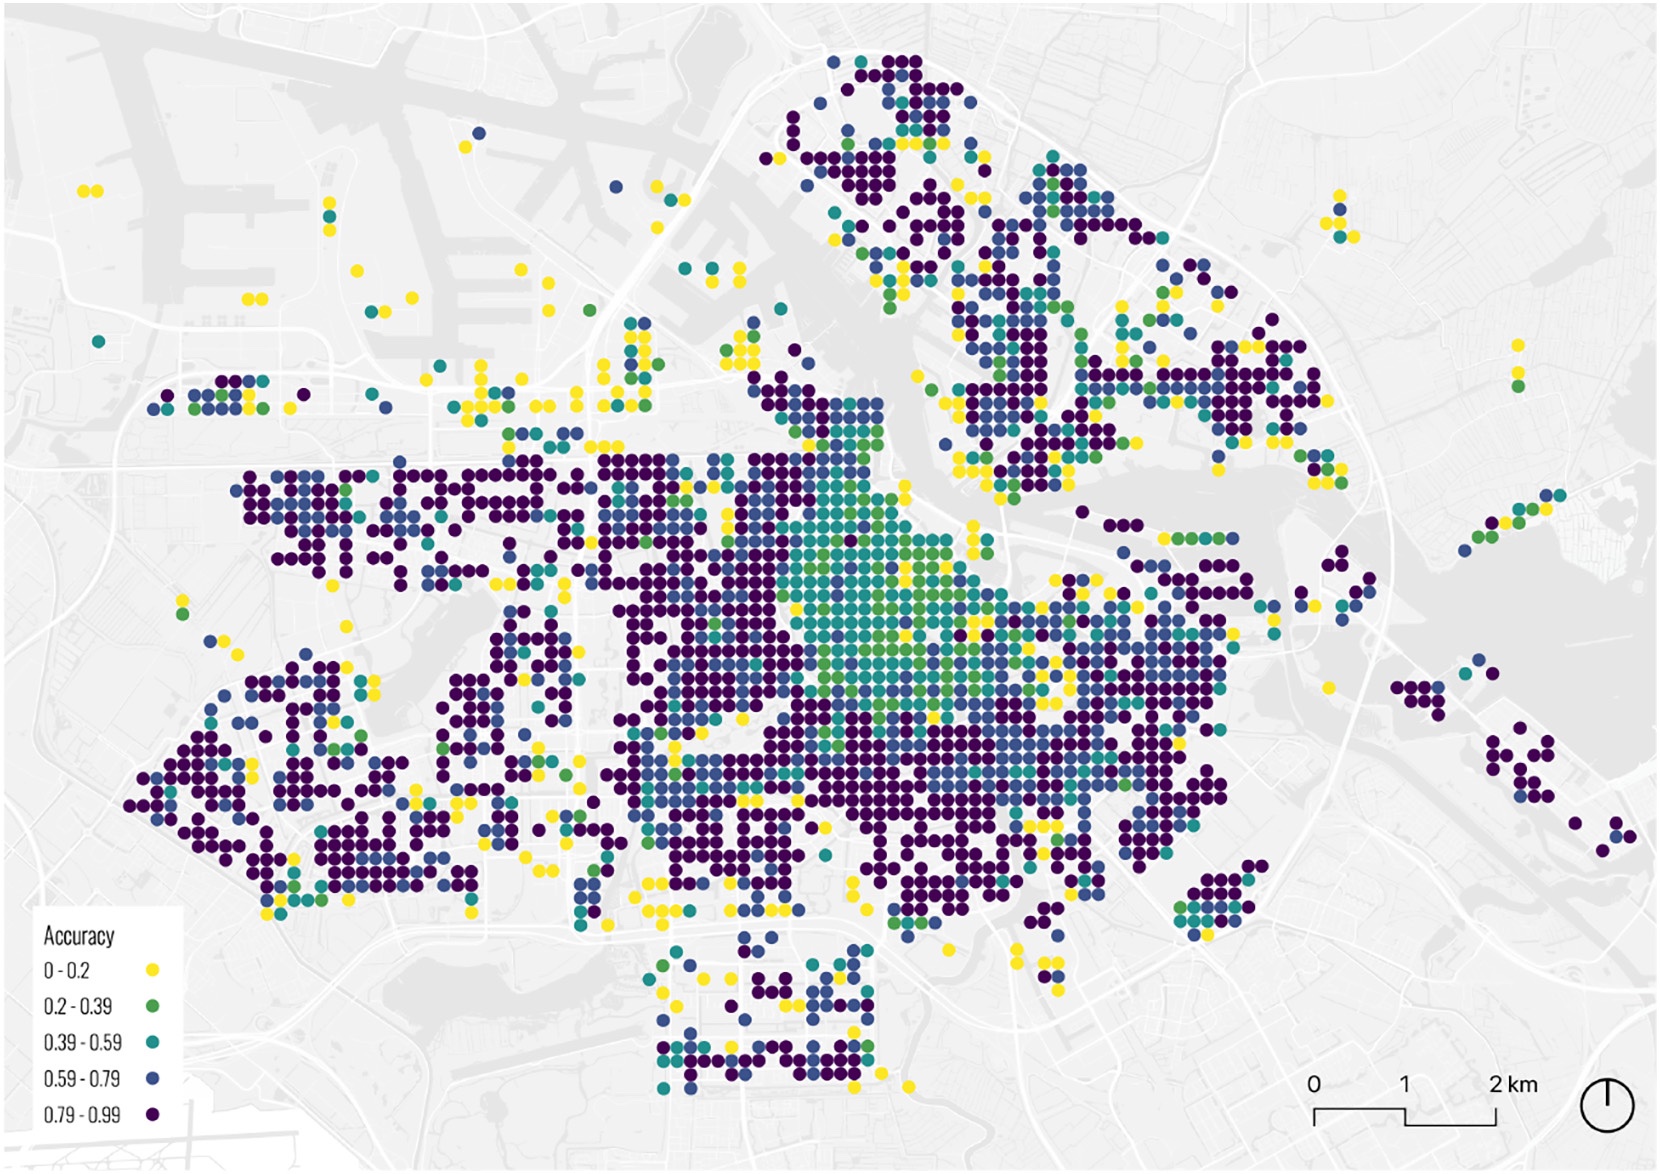
Aggregated to 150-metre grid cells, accuracy is lowest in that centre and higher in the outskirts, where Moran's I of 0.27 shows only weak spatial clustering of the results. The misclassified façades become a by-product with its own value: a map of where renovation and heritage-style construction has happened, useful for urban renewal, conservation and the study of gentrification.
06
What the network looks at
A class activation map highlights the pixels that pushed the model towards its answer. Across every epoch the hot spots sit in the same place: the windows and doors between the first and second floors. Ground-floor shopfronts, parked cars, bicycles and pedestrians are ignored, with no cropping or masking needed. The model found the architecture on its own.

Line the crops up by epoch and a history of the Dutch window appears. Early windows are tall and narrow, with wide frames, deep reveals and ornament around them. From the interwar years onward they turn square or horizontal, their frames thin out, decoration falls away and the glass sits almost flush with the wall. The model never saw a textbook of architectural styles. It inferred this from the labels alone.
07
How the epochs relate to each other
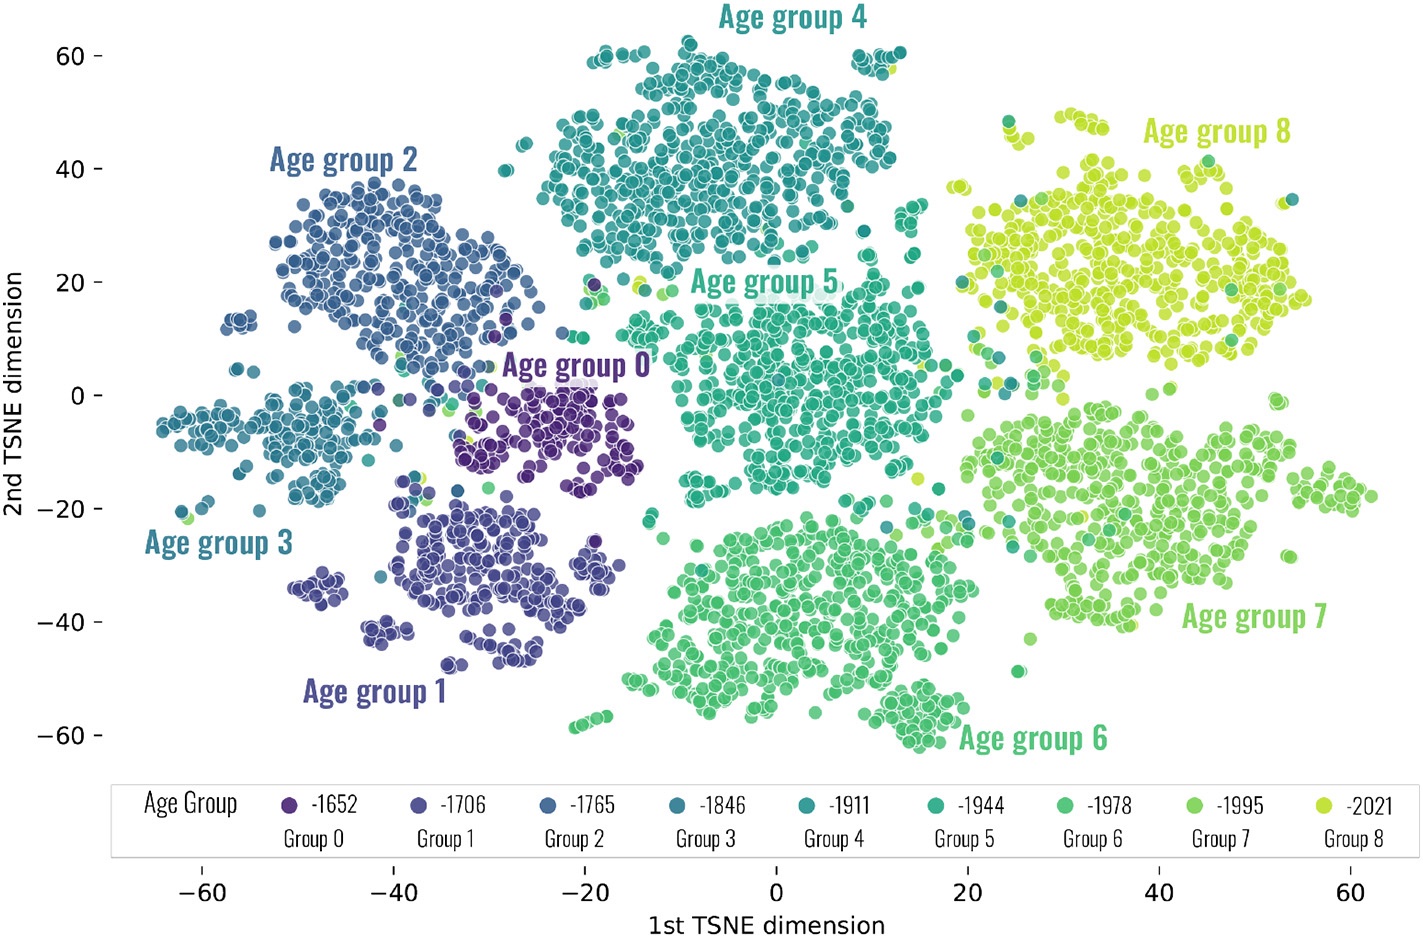
Behind its final answer the network holds a 256-number description of every façade. Projecting those descriptions onto a plane with t-SNE gives a map of how the model organises time. The nine epochs separate into nine clusters, and clusters from neighbouring epochs sit next to one another: the model has learned that 1765–1845 looks more like 1846–1910 than like 1978–1994.
One detail breaks the simple sequence. The oldest group, pre-1652, sits beside its natural neighbours but also touches the 1911–1943 and 1944–1977 clusters. That is a revival movement showing up in the data: early-twentieth-century architects borrowing from the seventeenth century, and the model noticing the resemblance.
Age is not the same as style
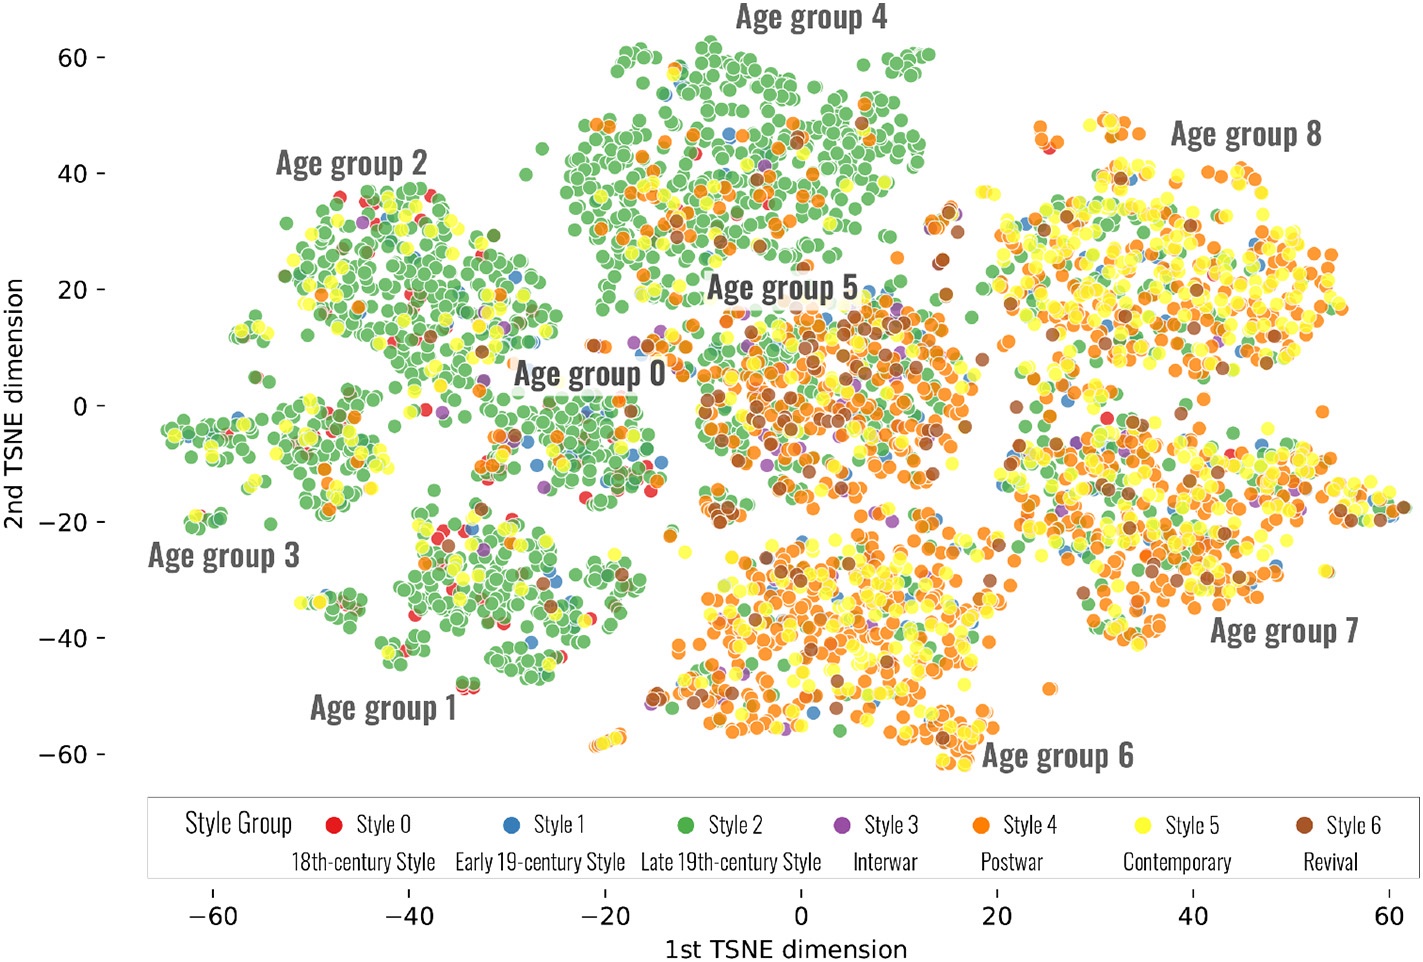
A second model, trained independently on a British dataset of 29,177 façades labelled with seven architectural styles, was run over the same Amsterdam photos. Colouring the t-SNE map by predicted style shows how the two line up. Everything built before 1911 reads overwhelmingly as late-nineteenth-century style: substantial bay windows, heterogeneous ornament, stained glass. Only in the two most recent epochs does the Contemporary style take over, and even there it is mixed.
Styles, in other words, arrive and spread gradually, and they do not switch over on the day an epoch boundary is drawn. Combining an age model with a style model makes that transition measurable.
08
Does Amsterdam's eye work in Stockholm?
Take the trained model, change nothing, and point it at 17,587 Stockholm façades with known construction years. The honest answer is that it mostly fails: 24% overall accuracy. But the shape of the failure is informative.
Amsterdam model, Stockholm buildings
Rows are true Stockholm epochs, columns the model's prediction. Compare with the Amsterdam matrix above.
of Stockholm buildings from 1706–1764 are read as 1846–1910. The two cities went through similar architectural phases, but Stockholm did so later: a temporal mismatch, not a visual one.
accuracy for 1978–1994 and 1995–2020. The newest buildings in both cities look alike, a measurable sign of the homogenisation that critics of modern architecture describe.
A little local data goes a long way
Fine-tuning the Amsterdam model with Stockholm samples. Values at 0, 1,500 and 15,000 samples are as reported in the paper; intermediate points are read from its Fig. 9.
Fine-tune with just 1,500 labelled Stockholm façades and accuracy jumps from 24% to 57%. With 15,000 it reaches 72%. A city without a building register does not need to build one from scratch. It needs a few thousand ground-truth samples and a model that already knows how to look.
09
What this changes
- Age at city scale, from public data. Street view plus an open footprint map is enough to date a city's buildings with about 81% epoch accuracy, no LiDAR or field survey required.
- A model you can interrogate. Activation maps, feature projections and cross-city confusion turn the classifier into an instrument for architectural history: tracing the evolution of windows, finding revival movements, measuring the convergence of recent construction.
- Errors as evidence. Where the model is "wrong", it is often flagging renovation and heritage-style construction, which is itself worth mapping.
Limits
The register records the year a building was originally completed. Renovations, extensions and rebuilds do not update it, so some of the model's errors are really errors in the ground truth. The study also uses a single network architecture; comparing backbones, adding morphological attributes such as height and footprint complexity, or including neighbouring buildings' ages could raise accuracy further. And with more cities, the spatial spread of styles across Europe could be traced with the same tools.
Sun, M., Zhang, F., Duarte, F., & Ratti, C. (2022). Understanding architecture age and style through deep learning. Cities, 128, 103787.
DOI Full paper (PDF) Back to research
Street-view imagery: Google. Building register: Basisregistratie Adressen en Gebouwen (BAG), via the 3D BAG project at TU Delft. Style dataset: Lindenthal & Johnson (2021), University of Cambridge. Supported by the National Natural Science Foundation of China (41901321) and the CCF-Tencent Open Fund (RAGR20210101).